Overview
Operating modern cloud-native systems means dealing with highly distributed architectures composed of multiple managed services. When something goes wrong, identifying the root cause quickly is often difficult. Engineers are forced to jump between metrics, logs, traces, and service dashboards, increasing both incident resolution time and operational fatigue.
To address this challenge, this post introduces the Alarm Context Tool (ACT)—a solution that enriches Amazon CloudWatch Alarms with actionable context and AI-generated insights. ACT correlates telemetry data across AWS services and uses Amazon Bedrock to summarize findings, identify probable root causes, and recommend remediation steps.
The result is faster diagnosis, reduced mean time to recovery (MTTR), and significantly improved observability.
Why Alarm Context Matters
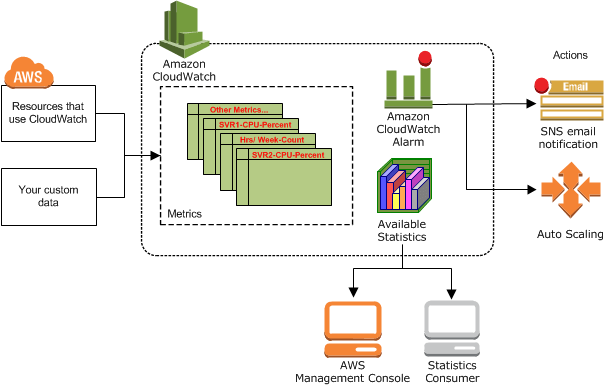
A standard CloudWatch alarm answers only one question: something crossed a threshold. It does not explain why.
ACT closes this gap by automatically gathering and analyzing contextual data at the moment an alarm fires, allowing operators to move directly from detection to resolution.
Key Benefits
1. Faster Troubleshooting
ACT automatically aggregates data from multiple sources, including:
- CloudWatch metrics and logs
- Distributed traces from AWS X-Ray
- Database insights from Amazon RDS Performance Insights
- Container telemetry from CloudWatch Container Insights
- Service-level events from AWS Health
By correlating this information, ACT provides a single, unified view of system behavior, dramatically reducing the time required to identify root causes.
2. Reduced Operational Cost
Instead of manually querying multiple AWS services during an incident, engineers receive context-rich alarm notifications that already include analysis and recommendations. This minimizes toil, lowers on-call effort, and improves overall operational efficiency.
3. Enhanced Observability with Generative AI
ACT uses Amazon Bedrock’s generative AI models to:
- Summarize complex telemetry data
- Highlight abnormal patterns
- Identify likely root causes
- Suggest relevant AWS documentation
This AI-assisted analysis allows teams to focus on decision-making, not data gathering.
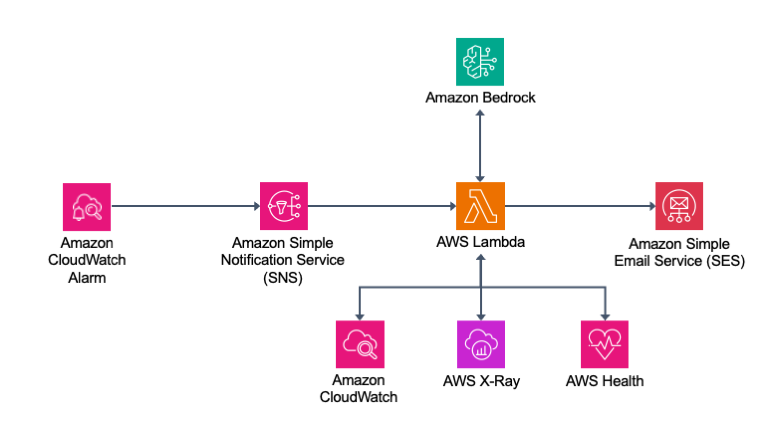
Architecture Overview

At a high level, the solution operates as follows:
- CloudWatch Alarm transitions to ALARM state
- Alarm publishes a message to Amazon SNS
- A subscribed AWS Lambda function is invoked
- The Lambda function collects:
- Metrics and logs from CloudWatch
- Traces from AWS X-Ray
- Database insights
- AWS Health events
- Alarm history and resource metadata
- Aggregated data is analyzed by Amazon Bedrock
- A summarized incident report is generated
- Notifications are sent to stakeholders via Amazon SES
Tracing within the Lambda function itself is enabled using AWS Lambda Powertools for deep execution visibility.
Example: ACT in a Real Incident
Scenario
A CloudWatch Synthetics canary alarm is triggered due to intermittent API failures and increased latency. This suggests potential instability in a backend microservice.
ACT is automatically invoked to analyze the situation.
Context Collection
Once triggered, ACT gathers:
- Metrics: Error rates, latency, request volume
- Logs: Canary execution logs from CloudWatch Logs
- Traces: X-Ray traces revealing downstream service behavior
- Health Events: AWS service disruptions or maintenance
- Alarm History: Frequency and recurrence patterns
- Resource Metadata: Canary configuration and dependencies
AI-Generated Analysis
Amazon Bedrock processes the collected data and identifies a likely root cause:
- A DynamoDB table is experiencing sustained read traffic beyond its provisioned throughput
- A downstream Lambda function is failing with
ProvisionedThroughputExceededException - Traffic spikes correlate with repeated alarm transitions
Notification Output
ACT sends an email report containing:
Root Cause Summary
The DynamoDB table backing the API is exceeding its provisioned read capacity, resulting in throttling and downstream API failures.
Alarm Behavior
The alarm has triggered multiple times in a short window, indicating a recurring and load-driven issue.
Supporting Metrics
- Canary failure detected
- 5xx server-side errors observed
- Success percentage dropped to zero during failures
Recommended Actions
- Increase DynamoDB provisioned throughput or switch to on-demand mode
- Review partition key design for traffic distribution
- Implement exponential backoff with jitter in application code
Reference Documentation
Links to relevant AWS best practices and DynamoDB capacity planning guides are included.
Conclusion
The Alarm Context Tool transforms CloudWatch alarms from simple threshold notifications into intelligent incident reports. By combining AWS observability services with Amazon Bedrock’s generative AI capabilities, ACT enables:
- Faster root cause identification
- Lower operational overhead
- Improved system visibility
- Smarter, data-driven incident response
For teams operating complex AWS environments, this approach significantly elevates monitoring from detection to actionable intelligence.
To get started, explore the ACT GitHub repository and follow the deployment instructions.
Tags: Amazon CloudWatch, Amazon Bedrock, Observability, Incident Response, AWS Monitoring, Generative AI

Leave a Reply